I have been a Happy Geek in Cyber Space!
I am a ColdFusion consultant and have always used ColdFusion since 4.5
I have been having fun with CF and the open source variants, recently had a project that used Railo & I have OpenBlueDragon runnning on my Pogoplug.
OpenBlueDragon had a debugger that runs right out of the box, pretty amazing! Due to compatibility issues I have not been able to run the current project on OBD. :(
I was tasked with getting the debugger running on my current assignment!
We are running Windows 7, Apache 2.2 & ColdFusion 8 with Eclipse 3.7.1
First, I need to acknowledge the sources of my success:
1) Charlie Arehart
2) Ben Forta
Ben Forta's site was a big help in the early days, Charlie Arehart does regular CFMeetups that are a big help!
Lets Get Started!
Using eclipse Version: 3.7.1 with CFEclipse & ColdFusion Extensions


Before we begin, turn off the windows firewall, or make an exception for port 5005
To be safe make a copy of C:\JRun4\bin\ jvm.config (your location may vary)
You need to add the following line to C:\JRun4\bin\ jvm.config :
-Xdebug -Xrunjdwp:transport=dt_socket,server=y,suspend=n,address=5005
So This line should read:
# Arguments to VM
java.args=-server -Xmx512m -Dsun.io.useCanonCaches=false -XX:MaxPermSize=192m -XX:+UseParallelGC -Dcoldfusion.rootDir={application.home}/ -Xdebug -Xrunjdwp:transport=dt_socket,server=y,suspend=n,address=5005
Open the ColdFusion Administrator.
Select "Debugger Settings" in the "Debugging & Logging" section.
Check "Allow Line Debugging".
Under Server Settings > Settings set Timeout Requests after ( seconds) to 300

You will have to restart the CF server
Click Start on the CF Admin Debugger, you will then see the Stop & Restart buttons

At this point you should get this response from the browser http://127.0.0.1/CFIDE/main/ide.cfm

The first thing you need to do in Eclipse is define the RDS settings for your ColdFusion server. These settings are used by the debugger, as well as the wizards, RDS panels, and more. To define your RDS connection do the following:
• In Eclipse, select Window->Preferences to display the Preferences dialog.
• Select Adobe in the tree, expand the selection, and select RDS Configuration.
• Click New to add a new server, or just select any server to edit it.
• Provide a description, host name, port, and login details, and then save. To use your local ColdFusion server specify 127.0.0.1 as the Host Name, 8500 as the Port (if using the integrated HTTP server), leave the Context Root blank, and provide the login information.
Use the host & port you connect to the Administrator with! (Thanks Charlie!)

Click "Test Connection" to make sure the RDS connection is working, and the click OK.

Click Test Debugger

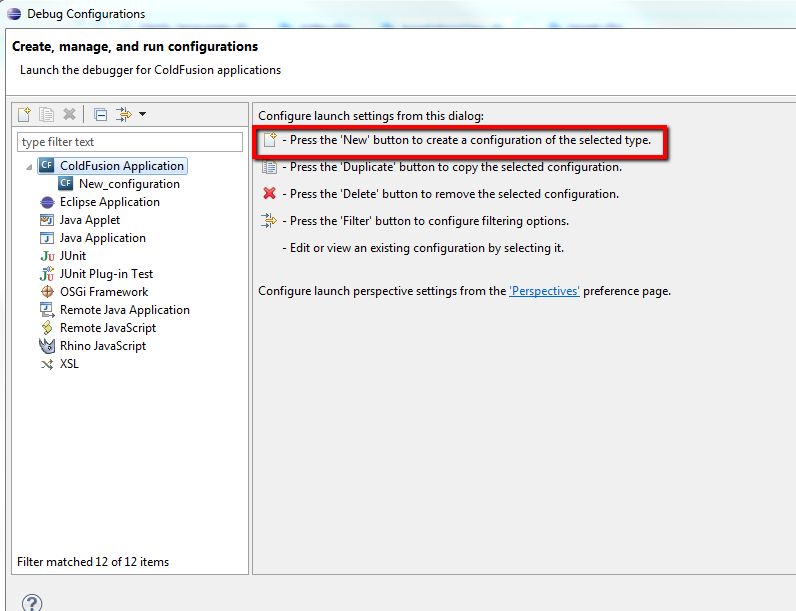
Configure a debugger by right mouse clicking on a project.

Create a new configuration by selecting "ColdFusion Application" and clicking the icon with the plus sign.
Set a break point in a project by right mouse clicking to the left of the line numbers

To Start debugging, click the down arrow by the bug and open the ColdFusion configuration you created.

Open your browser to the template that you set break points in. You will see the browser loading, the eclipse perspective will change to the debugger and will hold at the break point.

ENJOY!
Charlie Arehart commented below & this is a must read! Chapter 52 is a great guide! CFWACK8
3 comments:
Works the sam in CF9 on OS X Apache :)
Great stuff, Rich. And thanks for the kind regards. Yep, many have struggled with the debugger, and sometimes just a little help in the right direction is enough to get folks going. :-) Your entry is a great starting point.
If your readers might want to learn still more, including some tips, tricks, and traps, I can share links to a couple of the resources you may have been thinking of in your kind mention.
First is my 25-page chapter in the CFWACK books. Many call those the "Ben and Ray's books", though I'll sheepishly point out to readers that I too was a contributor to all three, for the CF 8 and 9 editions. :-)
Anyway, my debugger chapter is one of the few chapters that's available online, in PDF form. I link to it here:
http://www.carehart.org/articles/#2010_2
Now, that one is on using it within CFBuilder, in the CF9 version of the books.
Since your showing it above using CFEclipse, and the Eclipse Extensions for CF, I'll note that I covered it from that perspective in the CF8 verison of the book, and the chapter for that is also available online here:
http://www.carehart.org/articles/#2008_2
Similarly, I have recorded presentations (hour-long) from each perspective, at:
http://carehart.org/presentations/#cfb_debugger_setup
and
http://carehart.org/presentations/#cf8debug
Hope those may be helpful for your readers. Keep up thee good work.
Hey Rich,
I am running eclipse version 4.2.1 with ColdFusion server 10
I followed all your steps and was also successful in running the test debug part.
I know that the debugger is attached as I enabled the "Break on a CFML runtime exception" checkbox in "Debug settings" and got error messages in eclipse when I opened CF admin from the browser.
I am however unable to hit my application index.cfm file breakpoints.
I am new to ColdFusion and unable to figure this out.
Could you help me out?
Post a Comment